Introduction
Over the past four months, we’ve had extensive conversations with ABS market participants to discuss the new Asset Level Disclosure (ALD) requirements for public US securitizations. We discovered that many market participants have been overwhelmed with the volume of loan-level data and are at a loss on how they can readily derive value from it. In the following research piece, we answer commonly asked questions and provide guidance for incorporating ALD data into the investment process.
Specifically, we highlight the need for participants to (1) access standardized ALD data on-demand in an easily digestible and consistent manner, (2) unlock complex relationships and insights within and across securitization trusts, and (3) develop benchmarks for performance.
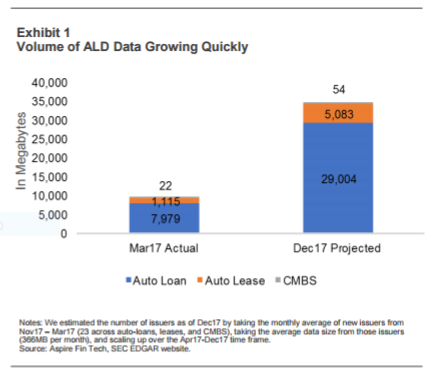
What is the scale of the data and how does one access it? By December 2017, we project there will be ~100 securitization trusts with over 34GB of data for just the auto-loan, auto-lease, and CMBS verticals. Given the data size and update frequency, we believe the market needs a centralized hub so users can access it easily in a consistent, clean format that has cash flow-specific fields.
What uses are there for this data? Once the data is cleaned and enhanced the opportunities for insights expand dramatically. Performing stratifications across trusts to compare asset pools and calculating performance curves are required at a minimum, but thereafter there are many opportunities to gain greater insight beyond what is possible using pool or rep-line data, including heat maps, dispersion analysis, and sector wide benchmarks.
Where Does Aspire fit in? Aspire has built an end-to-end data and analytics solution for auto-loan trust data, that is expanding to cover all the asset verticals with ALD requirements. The ALD Explorer is available on an open access basis with limited content and functionality, however once registered, users can access all content and functionality on a free-trial basis. Interested participants can access the ALD Explorer here.
Every institution should to be as informed as their most sophisticated contemporaries, which means they need a solution that encompasses everything from hosting and maintaining the ALD data to providing tools to gain insights from it. Going forward, fulfilling these business requirements will be critical because it will be part of the baseline needed for firms to participate in ABS markets intelligently.
Background
Why are issuers publishing this data?
As a result of Regulation A/B II from the Dodd-Frank Wall Street Reform and Consumer Protection Act, securitization issuers, starting in 2017, must post Asset Level Disclosure (loan-level characteristic and performance data) for loans in public securitization trusts on an ongoing monthly basis. These postings are made on the SEC EDGAR website. Asset classes covered by this requirement currently include auto-loans, auto-leases, and CMBS, but eventually will include other asset classes, including RMBS and potentially student loans.
What is the scale of this data? How quickly is it growing?
Going forward, we expect the volume of loan level data to grow quickly. As of April 2017, there have been 58 issuers and depositors posting up to 4 months of loan-level performance and characteristic data, containing information on over 1.4 million loans in aggregate. On average, each individual auto-loan posting is 220MB and typically contains over 70 mixed type fields for over 50,000 payment records on average. By December 2017 (Exhibit 1), we project there will be ~100 securitization trusts (over the verticals of auto-loans, leases and CMBS) with over 34GB of data of which the majority will be from auto-loan securitizations. These estimates do not account for new asset verticals.
Making Data Useful
Why is this ALD data important?
The size and difficulty in managing the loan-level data has caught many market participants by surprise. We urge them to embrace the new opportunities it enables. There is significant value in examining loan characteristics and performance both within and across trusts. For investors in the publicly issued securitization bonds, the value is obvious. They can analyze asset pool characteristics and performance and improve their asset (and liability note) valuation methodology. Beyond this, there are many tangible benefits for issuers and investors in similar markets and assets since they now have access to a broad sample of loans across trusts. To enable and realize the potential of this new data, participants require a partner with a specific skill-set that combines classical fixed income credit expertise with modern machine learning techniques and technology.
How does one access the data?
Given the data size and update frequency, Aspire believes the market needs a centralized hub so users can access it easily in a consistent format. The data is currently being posted on the SEC EDGAR site as ABS-EE files in XML format with only certain fields specified. Aspire provides a free service to all interested participants by converting these files to a CSV format and posting them on the ALD Explorer site. However, most participants need more than this because opening multiple files as spreadsheets or in a programming environment becomes untenable quickly because of their size. Also, the raw data does not include cash flow-specific fields like the month’s due amount, prepayment amount, or loan-to-value ratio, which need to be calculated the same way across trusts. Furthermore, there are discrepancies in the way certain field values are reported that need to be made consistent so that market participants can make apples-to-apples comparisons. For these reasons, a central database repository containing cleaned, enhanced, and standardized data becomes an ideal solution.
How does one ensure the data is consistent across trusts?
We emphasize that the market will need solutions to aggregate this ever-expanding dataset. The aggregator will need to demonstrate a mastery of the data by offering a raw data summary, the rules used to clean and enhance it, and additional field value verifications done in partnership with issuers to ensure consistency. On the last point, we think there may be a role for industry trade organizations to play in getting issuers to report values using a consistent methodology and additional useful fields to investors. We know that SFIG has already been active in this discussion.
Analytics for the Future
What tools are available to help one make use of ALD?
Once the data is cleaned and enhanced, the opportunities for insights expand dramatically.
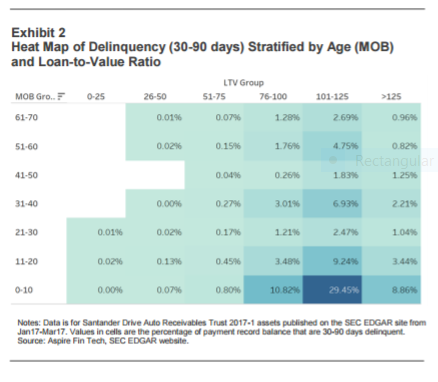
Performing stratifications across trusts to compare asset pools and calculating performance curves are required at a minimum and thereafter there are many opportunities to gain greater insight beyond what is possible using pool or rep-line data. For example, one could employ modeling techniques not to predict outcomes, but rather to identify the characteristics that most highly correlate with probability of default, prepayment, or delinquency. Using this method, investors could determine if defaults were over-represented in any cross section of characteristics (such as a geographic location, auto type, or credit score band). This can be done for any intra or inter-trust stratification and any loan status. For example, some cursory modeling on one auto-loan trust suggests that a loan’s age and loan-to-value ratio are highly coincident with statuses of delinquency (30–90 days). One could then display the delinquency percentage (represented by color intensity) against buckets of age and LTV on a heat map (Exhibit 2).
Are there any sector wide applications?
Eventually the industry may require data indices that display metrics (e.g. defaults, prepayments, roll-rates) for inter-trust segments overtime (e.g. an auto-loan subprime default index). These indices may be segmented into custom benchmarks and used to gauge asset pool performance, cohort performance (such as that trust’s underwriting standards across trusts (percentage of subprime borrowers for similar issuers). Currently, the time series of data for each trust is too shallow for the aggregation to be meaningful, but that will change as more deals’ data are added and current deals’ data expand. Below we show roll rates for prime borrowers across trusts versus the loan’s age as an example.
What other uses are there?
There are a multitude of potential uses once a longer data time series is published. For example,… please continue reading on Lending Times.